
Fig. 5.
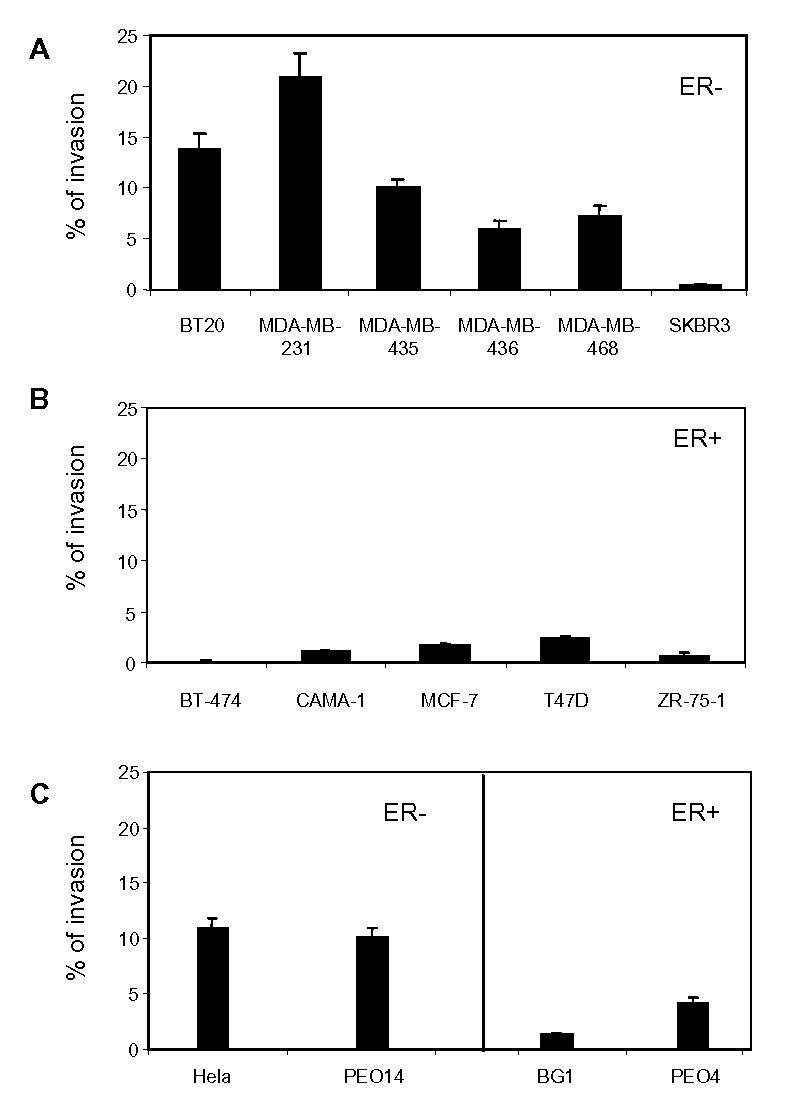
Invasiveness potential of cancer cells. Cells were plated on transwell or on control plates. After 24h of migration, the percentage of migrating cells was represented as the mean ± SD of three independent experiments. A. ER-negative breast cancer cells. B. ER-positive breast cancer cells. C. ER-negative cervix carcinoma or ovarian cells or ER-positive ovary cancer cells as in Fig. 3.