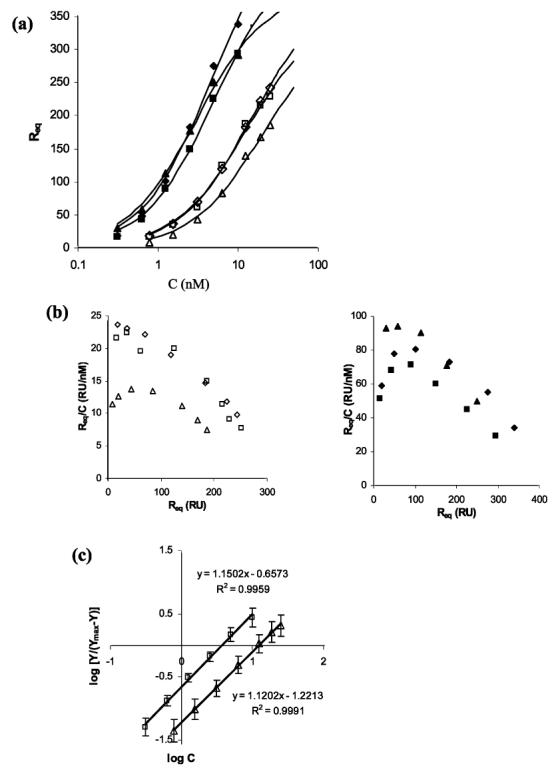
FIGURE 2.

(a) Three different sets of levels of steady-state binding of InlB (filled symbols) and InlB-ΔBΔGW1 (empty symbols) to immobilized heparin. Each set of data was independently fit to the 1:1 binding model. (b) Steady-state binding levels of InlB (left) and InlB-ΔBΔGW1 (right) in a Scatchard plot. The x-axis intercept provides a theoretical estimate for the total number of binding sites. Extension of the linear portion of these data, which includes the last four (InlB) or five (InlB-ΔBΔGW1) data points, predicts approximately two protein binding sites for each heparin chain. (c) Hill representation of the steady-state binding levels for InlB (□) and InlB-ΔBΔGW1 (△). A function of the bound protein [log Y/(Ymax - Y)] was plotted vs the logarithmic concentration of the amount of protein injected, where Y represents the molar ratio of InlB (or InlB-ΔBΔGW1) bound to heparin ([InlB]/[heparin]). The maximum binding level for each protein was based on two binding sites per heparin chain.
