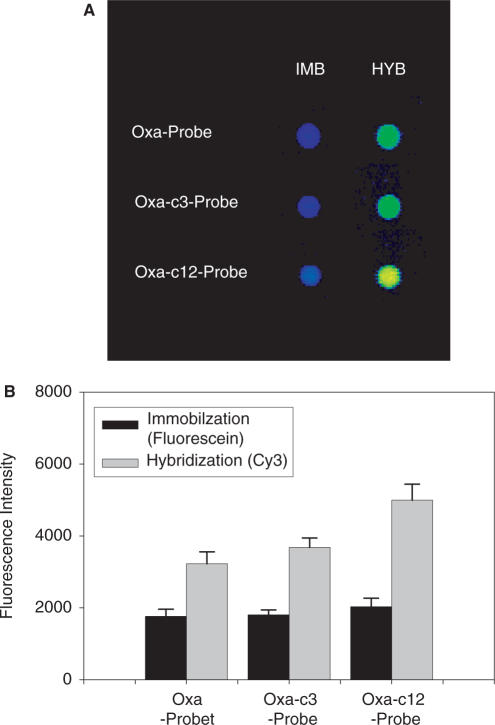
Figure 3.
(A) Fluorescence intensity data obtained for the spots. After the baking process (incubation for 1 h at 80°C) of the spotted glass slide was employed as conventional post-spotting treatment, the immobilization efficiency and hybridization efficiency of each spot were analyzed for the evaluation of the performance of Oxa as a linker, as explained in Materials and Methods section. The spots in the line of IMB show the fluorescence from fluorescein attached to the probe DNA oligomers, which indicates the efficiency of the immobilization, and those in the line of HYB the fluorescence from Cy3 attached to the target DNA oligomers (Cy3-XDHt-L, a long XDH target of 106-mer) hybridized with the probe, which is referred to the hybridization efficiency and also indicates the efficiency of the probe immobilization. It should be noted that the spots are named according to the name of the probe DNA oligomers as listed in Table 1 and that in the case of IMB and HYB, probes with and without fluorescein label were used, respectively. (B) The bar graphs representation of the average fluorescence intensities (arbitrary unit) of the spots in (A) [εmax (fluorescein) = 75 000 (M−1 cm−1) and εmax (Cy3) = 136 000 (M−1 cm−1)]. The error bar represents the SD of fluorescence intensity. The meaning of immobilization and hybridization in the box is the same as explained in (A).

