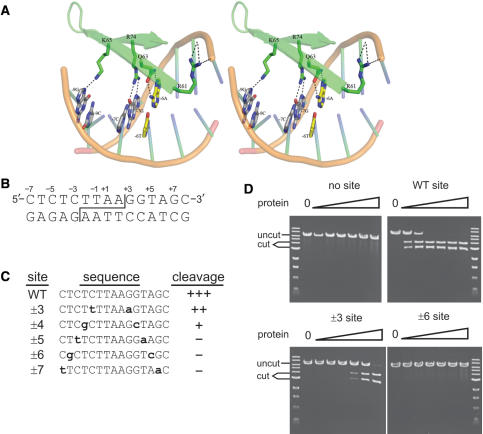
Figure 1.
Amino acid geometries were determined from the I-PpoI co-crystal structure (21). (A) Stereo representation of the native I-PpoI DNA–protein interface. Canonical contacts are present between Q63:±6A and R74:±7G. The native ±6A/T base pair is shown in yellow. Amino acid geometries were modeled using RosettaDesign. Sequence-specific hydrogen bonds are shown as black dotted lines. (B) Sequence of the native I-PpoI target or ‘homing’ site. Site cleavage across the minor groove (staggered line) generates complementary 4 base, 3′ OH-extended single-stranded ends. The convention for numbering target site base-pair positions is shown above the top strand. (C) Sequence and cleavage sensitivity of native and five variant I-PpoI target sites with palindromic base substitutions (shown lower case bold) at positions ±3 to ±7 assayed for native I-PpoI cleavage sensitivity. Cleavage sensitivity is indicated to the right of each sequence (‘+++’, fully sensitive; ‘–’, no cleavage). (D) Representative cleavage assays of native and mutant I-PpoI target sites by native I-PpoI protein. Linearized plasmid DNA (10 μM) was digested for 1 h with 10 pM to 1 μM native I-PpoI prior to agarose gel electrophoresis. (‘uncut’, plasmid substrates; ‘cut’, site-specific cleavage products).

