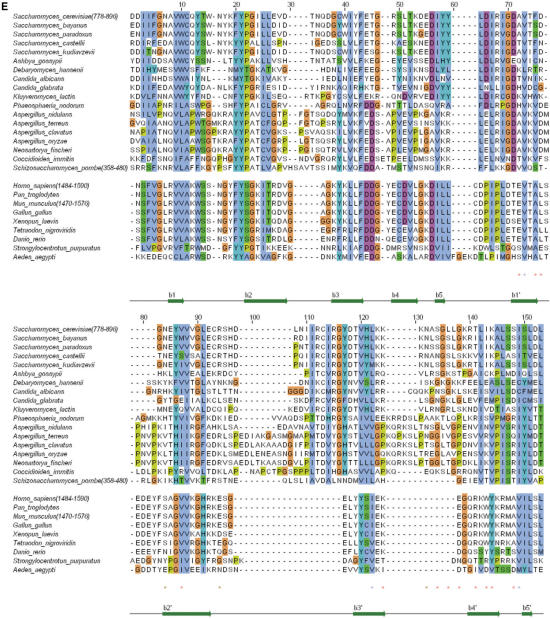
Figure 1.
(A) Ribbon representation of the ScRad9[754–947] 3D structure. Only fragment 762–896 is displayed. Assigned regions are in green, unassigned regions are in purple. The β-sheets are colored in magenta, except the strand β0′ which is in cyan. (B) Superimposition of the 3D structures of ScRad9[754–947] (magenta) and Crb2[358–507] (cyan). (C) Superimposition of the 3D structures of ScRad9[754–947] (magenta) and Mm53BP1[1463–1617] (yellow). (D) Ribbon representation of the 3D structure of the Rad9 fragment 762–896, calculated with three additional hydrogen bond restraints deduced from the structural comparison with Crb2 (see text). Colors are the same as in (A). (E) Alignment of the Rad9 sequence 778–896 with sequences of analogous proteins from 17 yeast species and 9 metazoans. This alignment was deduced from the structural alignment of ScRad9[754–947] with human 53BP1 tandem tudor domain [PDB reference 1XNI, (16); PDB reference 2G3R, (14)], mouse 53BP1 tandem tudor domain [PDB reference 1SSF, (15,31)] and fission yeast Crb2 tandem tudor domain [PDB reference 2FHD, (14)]. Red/blue stars indicate Rad9 solvent-exposed/buried residues whose backbone 15N or 1Hn NMR signals are affected by addition of a 10 mer oligonucleotide. Brown stars indicate Rad9 residues whose side chain 15N or 1Hn NMR signals are affected by the oligonucleotide addition.


