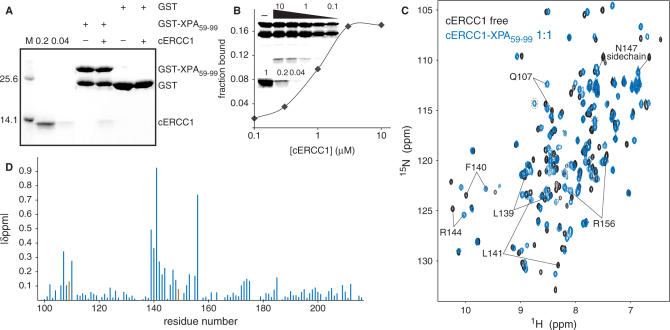
Figure 2.
ERCC1–XPA interactions. (A) GST pull-down assay with 3 µg of GST or GST-XPA fusion proteins in the presence or absence of 2 µM cERCC1. Here, 0.2 and 0.04 refer to respectively 20 and 4% of the input cERCC1 protein present in the GST pull-down assay. (B) Semi quantitative GST pull-down assay showing the fraction of cERCC1 bound to 3 µg of GST-XPA at the indicated [cERCC1] (µM). The upper part of inset shows a representative GST pull-down assay, where the various cERCC1 concentrations used are depicted above (10, 3, 1, 0.3 and 0.1 µM). The lower panel shows respectively 100, 20 and 4% of cERCC1 added to the assay. (C) Chemical shift perturbation of the cERCC1 1H-15N HSQC upon complex formation with XPA. Free cERCC1 spectrum is in black and XPA-bound spectrum in blue, while brown circles in the bound spectrum indicate G109 and H149 resonances. (D) Normalized chemical shift changes between free and XPA-bound forms versus the cERCC1 sequence. The p.p.m. difference for G109 and H149 was calculated by their resonances in the free cERCC1 spectrum at pH 5.5, and are colored brown.

