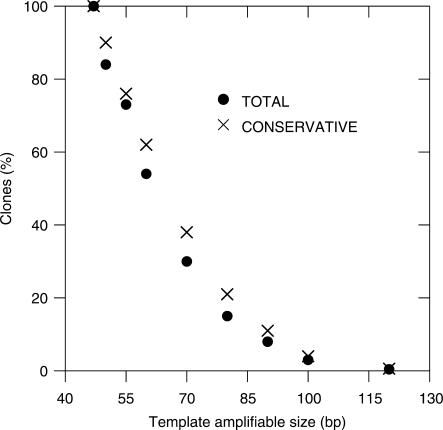
Figure 2.
Graph showing the percentage of clones of the single-cycle SPEX CDS and TCDS (Figure S1; Table 1) versus ‘template amplifiable size’ (in bp) by PCR. The best-fit function that describes the data is an exponential decay (ExpGauss) with formula y = exp(a+b*x+c*x2); where: a = 3.966; b = 0.019 and c = 0.050. The best-fit line was obtained by non-linear least-square curve fitting algorithms, and the curve shows the relationship between SPEX-amplified aDNA product length (x) and the percentage of all clones for each product length (y). Template amplifiable mean: 83.5 bp and SD: 24.9 bp. The minimum size considered was 47 bp, which corresponds to SPEX primer extension events that originally extended 1 base past the 3′-end of the final SPEX-3 partially nested forward PCR primer (Tables S1 and S2).

