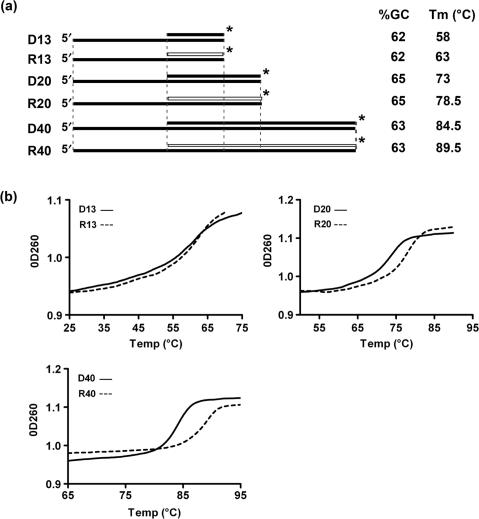
Figure 2.
Structure and stability of helicase substrates. (a) Schematic of the structures of substrates used for helicase assays. Black bars represent DNA strands; white bars are RNA strands. Vertical dotted lines indicate regions of identical sequence among the various substrates. The asterisk indicates the position of the 32P label. GC content of the substrates in the hybrid region and the experimentally determined Tm (±0.5°C, as in b) are also indicated for each substrate. (b) Thermal denaturation profiles of the helicase substrates depicted in (a). The experiment was done at least twice for each substrate with identical results. A representative experiment is shown.

