
Figure 2.
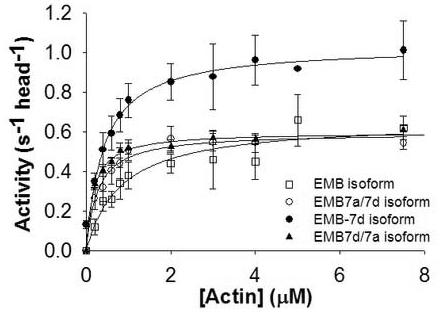
Actin-activated Mg2+ATPase activity of EMB-7a/7d and EMB-7d/7a isoforms
The maximal actin-activated ATPase activities for the exon 7 domain chimeric myosin isoforms (closed triangles: EMB-7d/7a, open circles: EMB-7a/7d) show no difference compared to the EMB isoform (open squares) but are decreased relative to the EMB-7d isoform (closed circles). Data were collected and fit with V = Vmax [actin] / (KM + [actin]) to determine Vmax and KM (Table 1). EMB data are from Littlefield et al. 10 and EMB-7d data are from Miller et al 16.