
Figure 4.
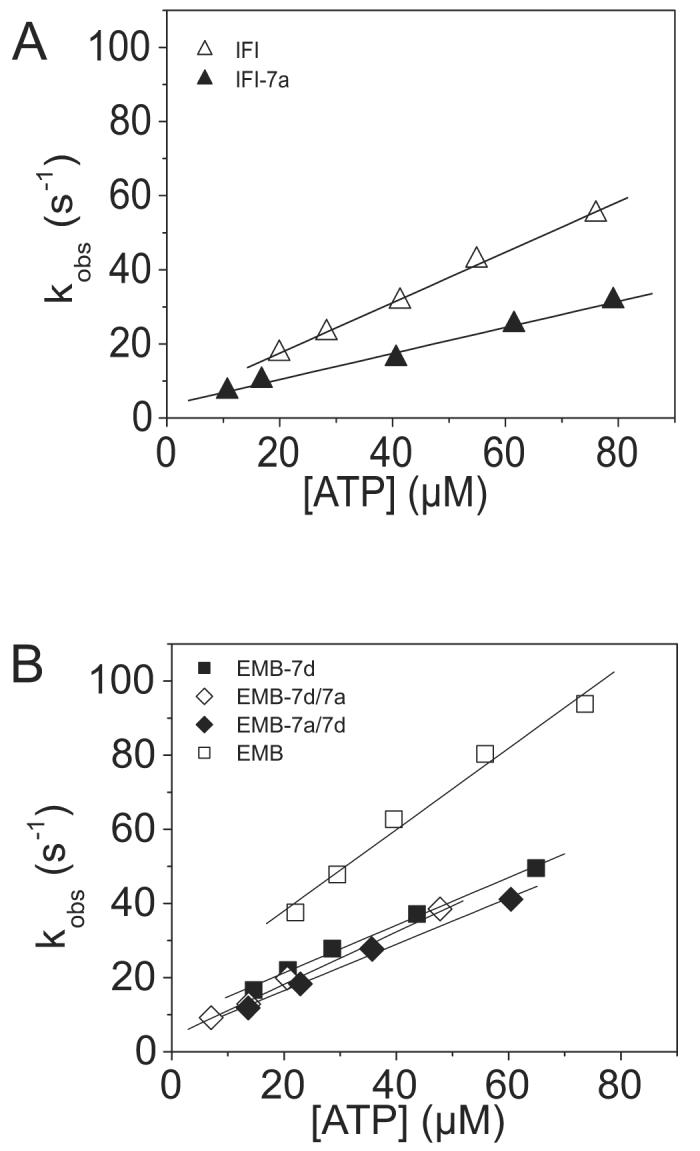
Kinetic determination of the ATP-induced dissociation rate (K1k+2) of the S1 isoforms from actin
The second order rate constant for the dissociation of S1 from actin is determined from a linear fit to the plot of the kobs vs. [ATP]. Light scattering transients monitoring dissociation of the acto-S1 complex (data not shown) were fitted with a single exponential at each ATP concentration in order to determine the kobs. A) The linear fits yielded values of 0.33 ± 0.07 106 M−1 s−1 for IFI-7a (filled triangles) as compared to as compared to 0.75 ± 0.08 106 M−1 s−1 for IFI (open triangles). B) The linear fits yielded mean values of 0.67 ± 0.18 106 M−1 s−1 for EMB-7a/7d S1 (filled triangles) and 0.66 ± 0.14 106 M−1 s−1 for EMB-7d/7a S1 (open triangles) as compared to 0.91 ± 0.13 106 M−1 s−1 for EMB S1 (empty squares) and 0.64 ± 0.05 106 M−1 s−1 for EMB-7d S1 (closed squares).