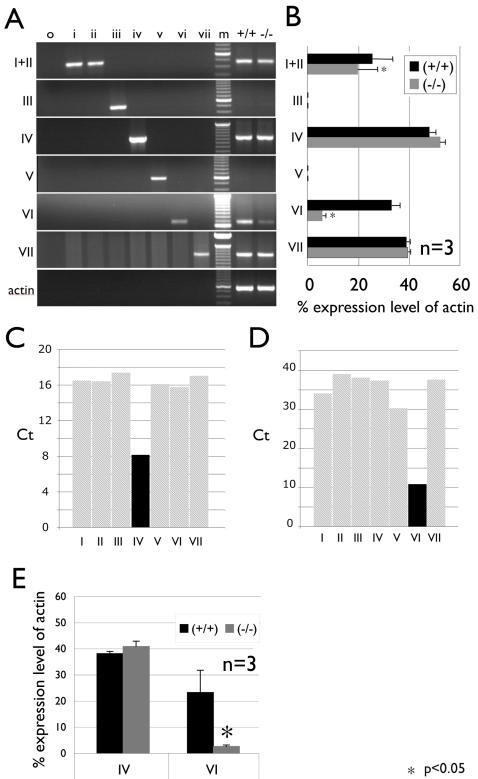
Figure 4. Variant-rDNA expression in basonuclin-null corneal epithelium.
A, A set of variant-specific RT-PCRs were used to measure the expression of seven v-rDNAs in the control and basonuclin-null corneal epithelia. The primer specificity (I to VII) is indicated on the left of the gel image; beta-actin PCR was included to monitor the relative quantity and integrity of RNA preparation. The templates are indicated above the gel image: i to vii, cloned v-rDNA controls; m, molecular weight marker (100 bp ladder), RNAs from control (+/+) and basonuclin-null (−/−) epithelia. B, The v-rDNA expression was quantified by measuring the fluorescence of stained PCR product and analyzed statistically. The v-rDNA expression level is expressed as percentage of that of the beta-actin PCR product (100%) (bar graphs). Each value was the average of 3 measurements (n = 3) of a mixture of RNA from four corneal epithelia of each genotype. The results of regular PCR were confirmed by quantitative PCR (real-time PCR or qPCR). C and D, Control experiments were performed to ensure the specificity of qPCR for v-rDNA IV (C) and VI (D). The Ct values of cloned templates are plotted; light gray, non-specific template and black, specific template. A lower Ct value signifies a higher specificity. E, RNA samples similar to that shown in A are measured by qPCR. The v-rDNA expression values are displayed as percentages of the reference gene (beta-actin). * p<0.05, ** p<0.01.

