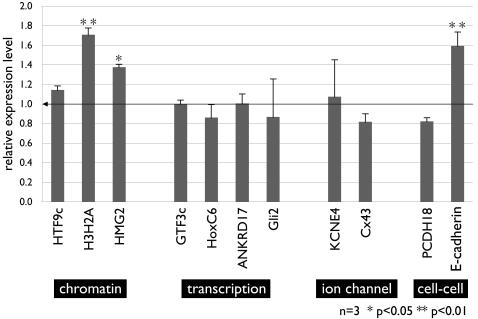
Figure 5. Transcript (mRNA) level of basonuclin-target genes in basonuclin-null corneal epithelium.
Relative mRNA level of basonuclin-target genes was analyzed by real-time PCR using total RNAs isolated from the control and basonuclin-null corneal epithelia. Each RNA preparation was a mixture of four corneal epithelia of the same genotype and the analysis was performed in triplicates (n = 3). The average level of expression was normalized to beta-actin. The bar graph represents the average of three RNA preparations and their statistical variation (s.d.). The gene identity is given below each bar and the pathway of the genes indicated with white letters on a black background. * P<0.05, ** P<0.01.

