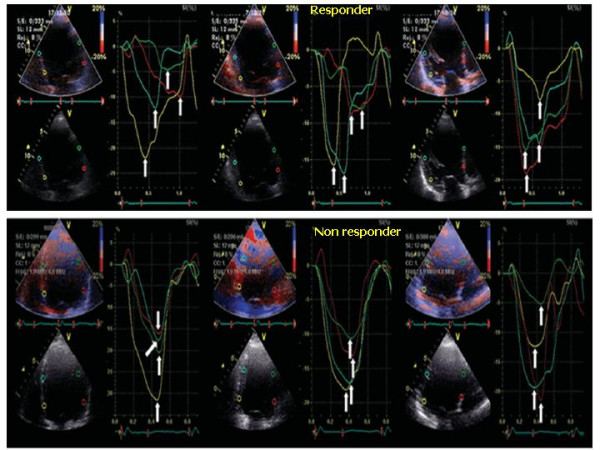
Figure 10.

Longitudinal strain-derived dyssynchrony. Longitudinal strain-derived dyssynchrony illustrated by 12-TPS-SD (white arrows) evaluated in the three standard apical views (4-, 2- and 5-chambers) before CRT. In a responder patient (upper panel) TPS values are disperse indicating a severe degree of dyssynchrony. In a non responder patient TPS are very close to each other, indicating a low level of intra-ventricular dyssynchrony. (Modified from Mele D et al, Eur Heart J 2006;27:1070–1078).
