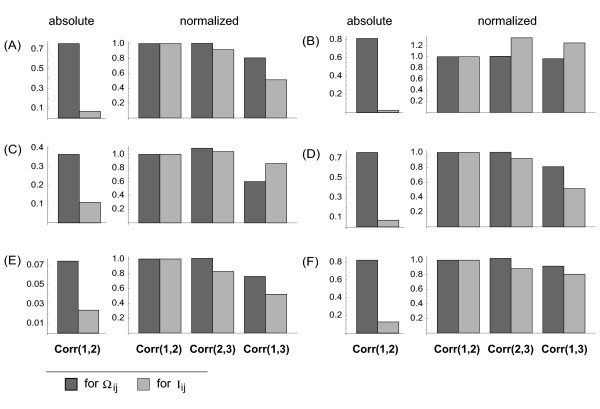
Figure 11.
Correlation coefficients of Ωij and Iij, respectively, between the different intervals of experimental data. On the left-hand side of each image segment one can see the absolute values of correlation coefficients between intervals one and two (Corr(1,2), cf. Figure 10). The columns on the right-hand image parts show correlation coefficients between the intervals normalized to Corr(1,2). The notation (A) to (F) corresponds to that of Figure 9.

