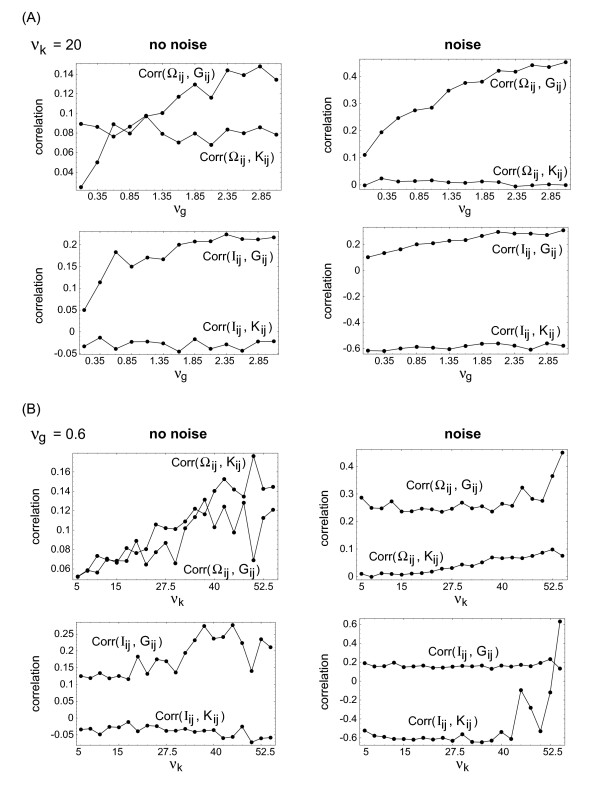
Figure 7.
Correlation coefficients between the reconstructed matrices Obsij and the parameter distributions Parij as a function of the two variability strengths νg (at fixed νk = 20) and νk (at fixed νg = 0.6), both for the patterns without noise (left-hand side) and with noise (right-hand side). The curves are cross sections of the correlation arrays from Figures 4 and 6.

