
Figure 1.
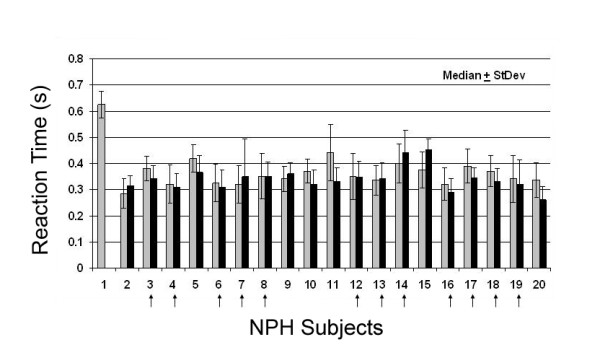
Reaction time in NPH. Plot of Reaction times to movement onset (RT/MO) for each NPH subject at baseline (gray bars) and following CSF removal (black bars; n = 45). Data are median values ± standard deviation in s. No significant differences were demonstrated in NPH RTs following CSF drainage via a temporary spinal catheter (nor later by VP shunt). Vertical arrows indicate those NPH subjects who later underwent shunt placement.