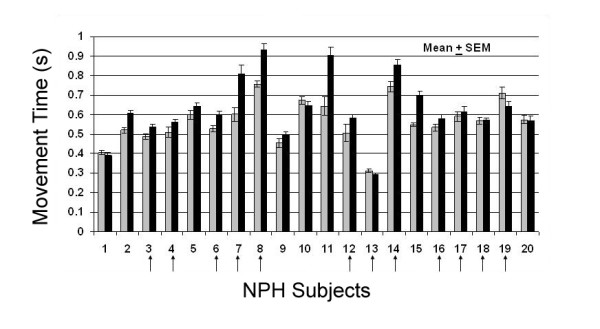
Figure 2.

Movement time in NPH. Plot of stimulus-initiated (gray bars) and self-initiated (black bars) movement times (MT) of each NPH subject at baseline in s (mean ± SEM; n = 45). A subset of subjects demonstrated statistically prolonged movement times during the self-initiated tasks compared with stimulus-initiated tasks. Vertical arrows indicate those NPH subjects who later underwent shunt placement.
