
Figure 4.
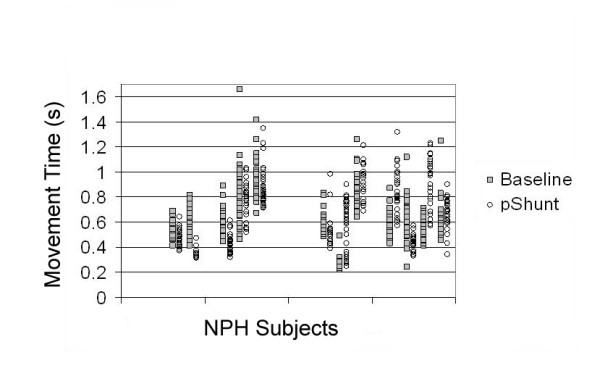
Self-initiated movement in NPH. Raw data plots of the 12 NPH patients who received V-P shunt during self-initiated movement time (MT) tasks. The Y axis represents time in s, separate patients are plotted on the X axis with MT from baseline measure (gray squares) and following V-P shunt placement (open circles). Those subjects that demonstrated changes in MTs (whether prolonged or decreased) with CSF drainage, demonstrated similar changes from baseline. (For comparison, average control self-initiated movement times were 513 ± 18 ms).