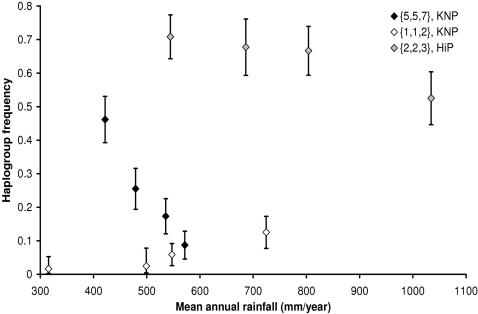
Figure 2. Correlation between haplogroup frequency and mean annual rainfall.
{n
1, n
2, n
3}: haplogroup. Black diamonds: mean annual rainfall in the three years before birth. Open diamonds: rainfall in the second year before birth. Grey diamonds: rainfall in the year of birth. Error bars: standard error ( ), except for the two lowest data points of haplogroup {1,1,2} in which the haplogroup was observed only once. Here they correspond to a chance ≥84% of sampling ≤1 (positive error bar) or ≥1 haplogroup (negative error bar). Sample sizes were equalized as much as possible.

