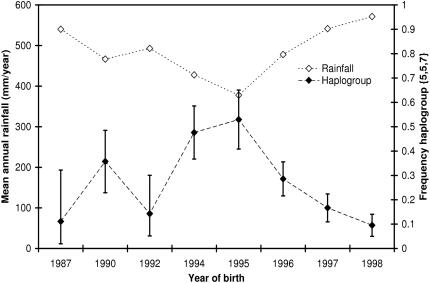
Figure 3. Negative correlation between frequency haplogroup {5,5,7} in KNP and rainfall in the three years before birth.
Error bars: standard error ( ), except for the two lowest data points in which the haplogroup was observed only once or twice. Here they correspond to a chance ≥84% of sampling ≤1 or 2 (positive error bar) or ≥1 or 2 haplogroups (negative error bar). Years of birth 1987, 1990, 1992 and 1994 consist of pooled years because of the small sample size (with the x axis corresponding to the average year of birth). Years of birth were pooled with similar amounts of rainfall in the preceding three years (difference<69 mm/year).

