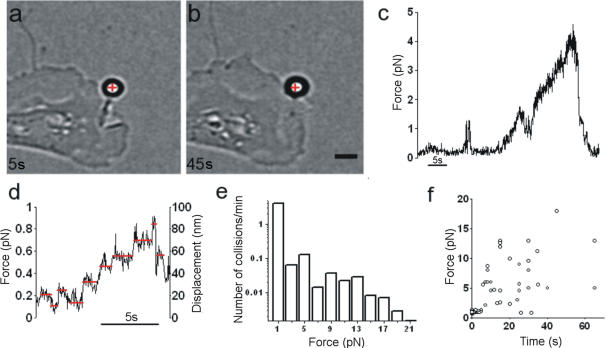
Figure 4. Force exerted by lamellipodia.
(a–b) A lamellipodium growing and pushing a trapped bead. The red cross indicates the equilibrium position inside the optical trap. Scale bar, 2 µm. (c) Fneu in the x,y plane obtained from a QPD recording. Trap stiffness was 0.009 pN nm−1. (d) The force exerted by a lamellipodium showing step-like jumps. Red lines, drawn by eye, indicate presumed discrete levels. The QPD recording was sub-sampled and filtered at 50 Hz. After low-pass filtering, the value of σ was reduced to 0.05 pN. Trap stiffness was 0.01 pN nm−1. (e) Histogram of forces measured during collisions between lamellipodia and trapped beads. Data reflect 65 experiments, each lasting 2 min. (f) Scatter plot of force duration for the collisions shown in (e).

