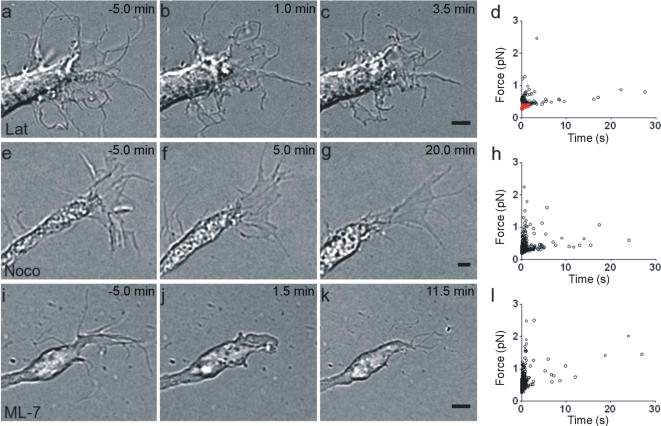
Figure 6. Effect of inhibitors on force exertion.
A growth cone before (a) and after (b–c) application of 100 nM latrunculin A. No motion was observed after 3.5 min of exposure. (d) Scatterplot of force duration for collisions after application of 50 nM (black symbols) and 100 nM (red symbols) latrunculin A. A growth cone is shown before (e) and after (f–g) application of 50 nM nocodazole. The growth cone retracted, but filopodia continued to move for at least 30 min after drug exposure. (h) Scatterplot of force duration for collisions after application of 50 nM nocodazole. A growth cone is shown before (i) and after (j–k) application of 4 µM ML-7. Filopodia quickly retracted but then regrew and moved for at least 20 min after drug application. (l) Scatterplot of force duration for collisions after application of 4 µM ML-7. Scale bars, 2 µm. Drugs were added at time 0.

