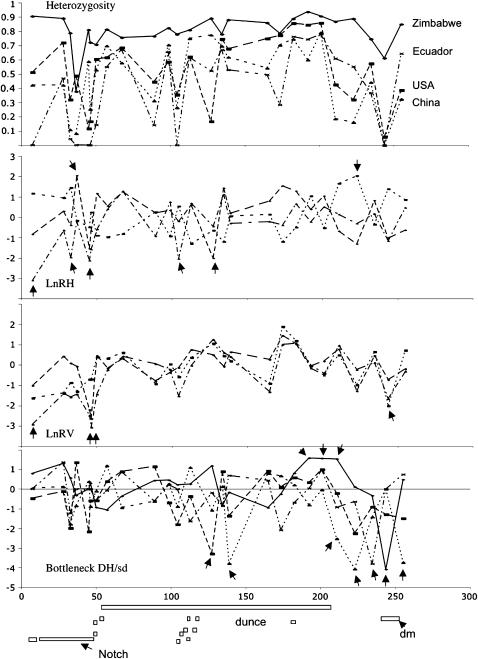
Figure 1.—
Depiction of the levels of heterozygosity, LnRH, LnRV, and Bottleneck test statistics across the 26 Notch to dm microsatellites. Annotated open reading frames within the region are depicted by boxes along the bottom. Due to the scale of the figure we do not depict exon–intron boundaries. The open reading frames in order are kirre, Notch, CG18508, Fcp3C, CG3939, CG14265, ng2, ng3, ng1, dunce (represented as a box above other coding regions), ng4, pig1, sgs4, CG10793, and dm. For reference, the coordinates for open reading frames of Notch, dunce, and diminutive on the microsatellite sequence scale are 10093 to 45459, 110164 to 204572, and 240390 to 250695, respectively. Arrows indicate significant test results before Bonferroni correction.

