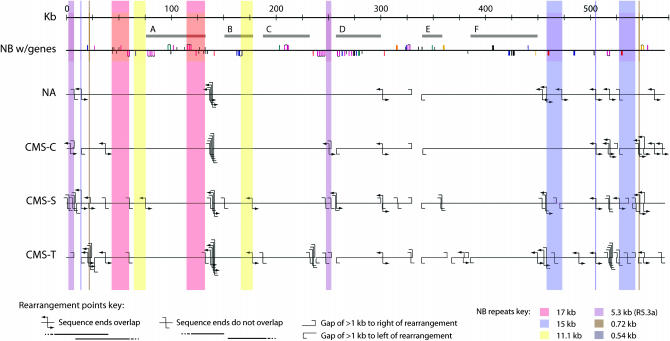
Figure 2.—
Multiple rearrangements lead to small syntenic regions. The NA, C, S, and T mitochondrial genomes are arranged relative to the linearized NB map. NB gene positions are indicated by vertical lines colored as in Figure 1. Horizontal gray bars (A–F) indicate regions of synteny (15–66 kb) among all five maize mitochondrial genomes. Colored boxes indicate regions that are present in NB as repeats of >500 bp, using the color scheme of Figure 1. Some very closely spaced rearrangements may be even closer than indicated due to line separation requirements for visibility.

