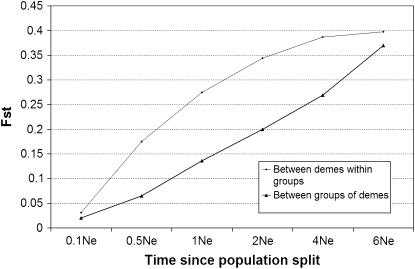
Figure 3.—
Population differentiation in a hierarchical island model for two groups of two demes. Polymorphism data was generated by coalescent simulations using the ms program (Hudson 2002). To calculate FST for the simulated data sets we imported the output of ms into ProSeq v3 (Filatov 2002). The simulations assumed that all demes were of equal size with θ = 2 and 10 sequences were sampled from each deme. Gene flow was 5 times higher for demes within a group (4Nm = 0.5) than between the 2 groups (4Nm = 0.1). Going backward in time, at time T (measured in Ne generations) all 4 demes merge into a single deme. Dots represent differentiation between demes within a group of demes and triangles represent differentiation between groups of demes.

