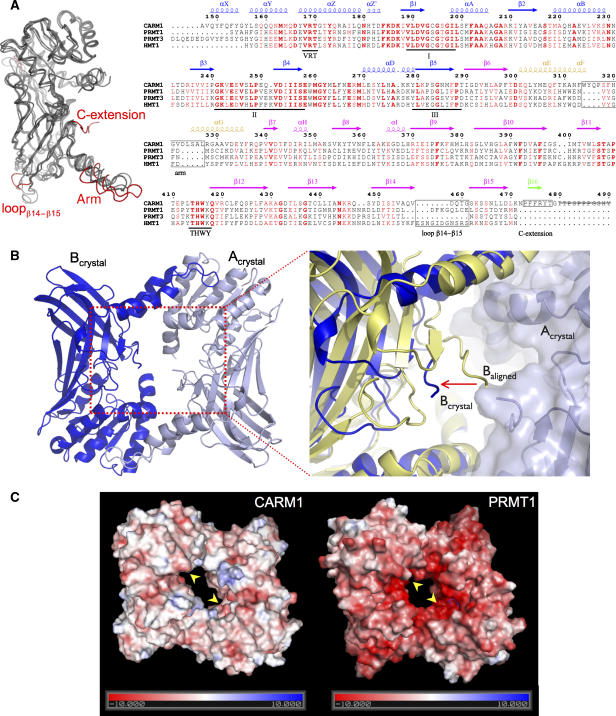
Figure 3.
Unique structural features of CARM1. (A) Left: superimposition of the catalytic cores of mouse CARM1, rat PRMT1, rat PRMT3 and yeast Hmt1. The major structural differences between CARM1 and PRMT1/PRMT3/Hmt1 are highlighted in red. Right: structure-based sequence alignment of CARM1, PRMT1, PRMT3 and Hmt1. Secondary structure elements of CARM1 are coloured as in Figure 2A. Numbers correspond to the CARM1 sequence. Three signature motifs (I, II, III) for class I SAM-MT and two PRMT-specific motifs (VRT and THWY) are underlined. Major structural differences between CARM1 and PRMT1/PRMT3/Hmt1 are indicated in black boxes. Residues 480–490 of the CARM1-crystallised construct (strikethrough) are not visible in the electron density map. (B) CARM1 dimer has a larger central cavity. Left: a CARM1 dimer, rotated 180° along the x-axis relative to the view in Figure 2A, is shown with chains Acrystal (pale blue) and Bcrystal (blue). Right: an enlarged view of the dimer cavity. When chains A and B of the CARM1 dimer are superimposed individually on the equivalent chains of the PRMT1 dimer, chain B of the CARM1 dimer in the crystal (Bcrystal, blue) is >7 Å away (arrow) from the dimer centre relative to the aligned chain B (Baligned, yellow). (C) Surface representation of CARM1 (left) and PRMT1 (right), coloured in a scale of electrostatic potential (kT; positive in blue, negative in red). The active sites in CARM1 and PRMT1 are shown (arrows).

