Figure 2.
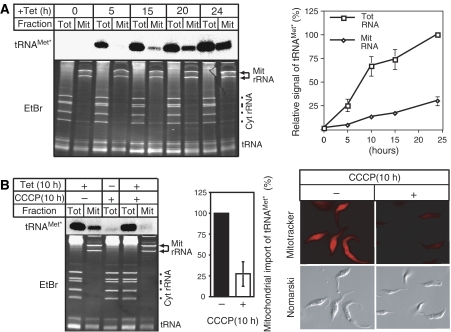
Tetracycline-inducible expression of a tagged tRNA. (A) Time course of induction. Appearance of the tagged tRNAMet (tRNAMet*) in the cytosol (Tot) and in digitonin-extracted mitochondria (Mit) was monitored by Northern analysis (left side, upper panel). The lower panel shows the corresponding ethidium bromide-stained gel (EtBr). Positions of the mitochondrial rRNAs (Mit rRNA) and the cytosolic rRNAs (Cyt rRNA), as well as the tRNA region are indicated. Graph: Quantitative analysis of four independent experiments of the type shown on the left. The signal corresponding to the tagged tRNAMet at 24 h of induction in the total RNA fraction was set to 100%. Standard errors are indicated. (B) Mitochondrial import of newly synthesized tagged tRNAMet requires the membrane potential. Left panel: Expression of the tagged tRNA was induced for 10 h in absence (−) and presence (+) of 20 mmol of the uncoupler CCCP, and analyzed by Northern blot. Middle panel: Quantitative analysis of four independent experiments of the type shown on the left. The signal in untreated cells that corresponds to the mitochondrially localized tagged tRNAMet after 10 h of induction was set to 100%. Standard errors are indicated. Right panel: Mitotracker-staining of untreated (−) and CCCP-treated cells (+). The y-axis images of the ethidium bromide-stained gels have been electronically compressed by a factor of approximately 2.

