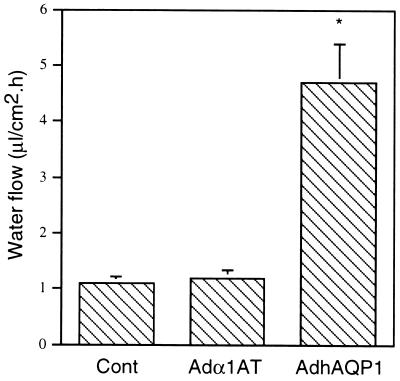
Figure 3.
Net fluid secretion rate of MDCK cells. Net fluid secretion rate of control, Adα1AT-(MOI of 100)- and AdhAQP1-(MOI of 100)-infected MDCK cells was measured as described in Methods. The results are expressed as water flow in microliters of fluid secreted per cm2 per h and are the mean ± SEM of three separate experiments, each performed in triplicate. The results were analyzed using an ANOVA. ∗, P < 0.05 compared with control and Adα1AT-infected cells.

