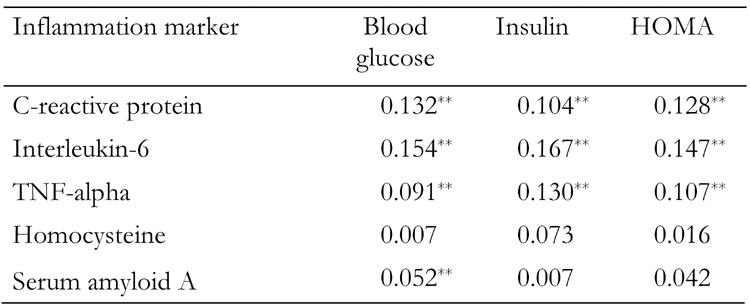
Table 2. Partial correlation coefficients between glycemic control indices and inflammatory levels, after adjusting for age, sex and BMI.

Data are mean ± SD. TNF: tumor necrosis factor. HOMA: homeostasis model assessment. * p < 0.05; ** p < 0.01.

Data are mean ± SD. TNF: tumor necrosis factor. HOMA: homeostasis model assessment. * p < 0.05; ** p < 0.01.