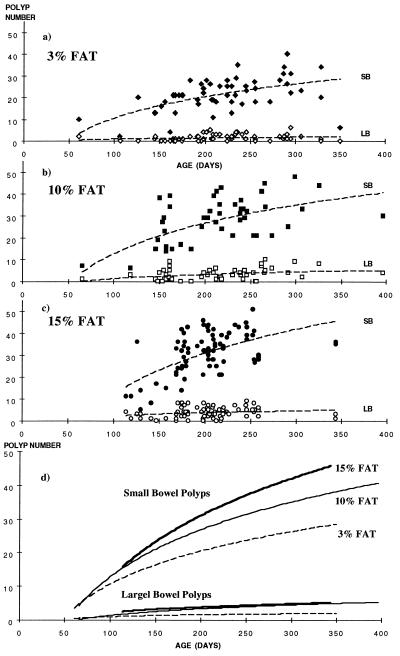
Figure 3.
(a–c) Small (solid symbols) and large (open symbols) bowel polyp counts in MIN (C57BL/6J-Min/+Apc) mice vs. age on the three different diets with best-fit logistic regression lines. (d) Logarithmic regression comparisons between the three different diets from the individual data in a–c (i.e., three graphs superimposed).

