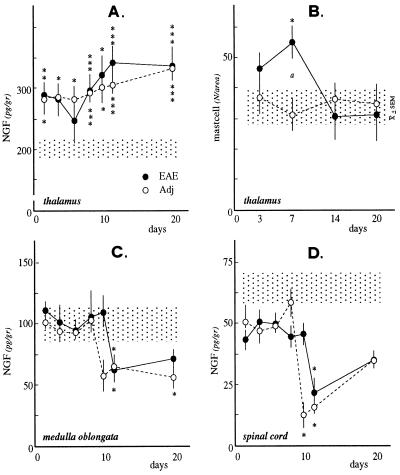
Figure 3.
(A, C, and D) NGF content in different brain areas during development of EAE and CFA-induced inflammation. (B) Number of thalamic mast cells in the thalamus during EAE. Mast cells have been counted in 5 matching sections from the thalamus of each animal, and the relative number has been normalized according to the sampled area. Statistical analysis: ANOVA and Dunnett’s test; ∗, P < 0.05, ∗∗, P < 0.01, ∗∗∗, P < 0.001; a, Student’s t test, P < 0.05.

