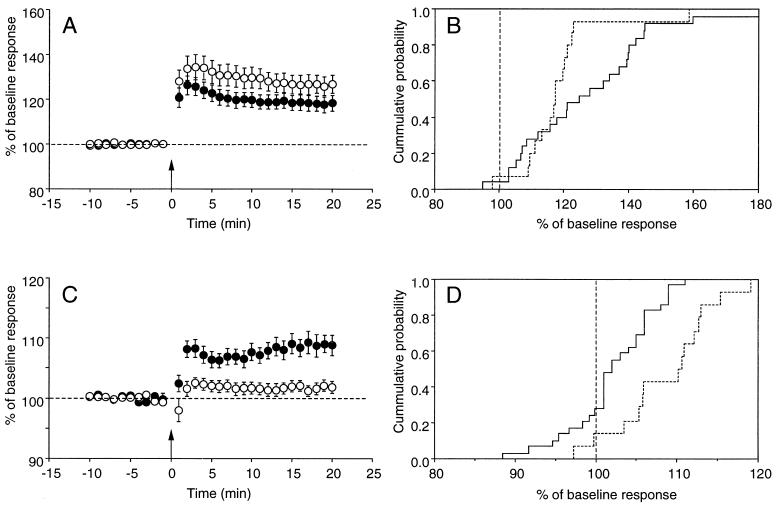
Figure 1.
LTP in young and old, wild-type and αCaMKII(−/−) visual cortex. (A) The effects of TBS of layer IV (indicated by the upward arrow) on synaptic field potentials in layer III of wild types. Each point represents the mean response (±SEM) normalized to the average baseline value. Open circles, data from adults (n = 25 slices); solid circles, data from 4- to 5-week-old mice (n = 15 slices). (B) Cumulative histograms showing responses 20 min after TBS in all wild-type slices from adult (solid line) and young (dashed line) animals. (C) The effects of TBS on layer III field potentials in slices from αCaMKII(−/−) mice. Open circles, data from adult mutants (n = 29 slices); solid circles, data from 4- to 5-week-old mutants (n = 14 slices). Note that the scales of the y-axes differ in A and C. (D) Cumulative histograms showing responses 20 min after TBS in all αCaMKII(−/−) slices from adult (solid line) and young (dashed line) animals.

