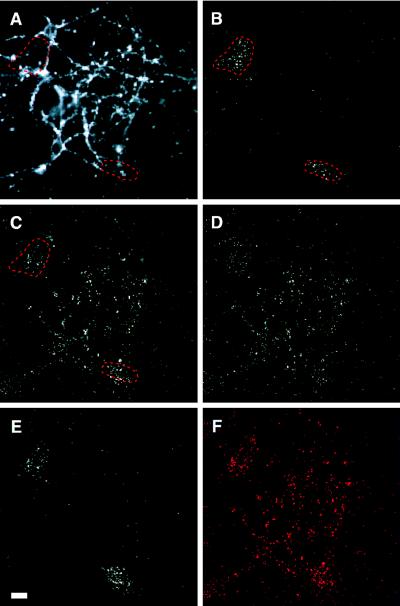
Figure 2.
Hippocampal neurons expressing synaptolucin-1, imaged by wide-field microscopy. About 60% of the neurons were infected by HSV transducing synaptolucin-1. (A) The synaptic map, revealed by loading nerve terminals with FM 4-64. The fluorescent signal from FM 4-64 was acquired at low intensifier gain and averaged over 32 video frames. (B–E) Photon registrations accumulated from synaptolucin emissions over 30 sec, obtained at 30 nM luciferin, maximum image intensifier gain, and a discriminator value for photon detection that suppressed background and equipment noise (photon counts in the presence of a depolarizing stimulus but the absence of luciferin) to an average of 1.06 photon registrations per 100-pixel field. The preparation was imaged successively in normokalemic solution (B) and during three hyperkalemic challenges to induce exocytosis, performed in either the presence (C and D) or the absence (E) of external Ca2+. Ten minutes under resting conditions elapsed between each of the successive stimuli. The dashed red lines in A–C mark areas of stimulation-independent synaptolucin activity, in all likelihood due to virus-infected glial cells. (F) Superimposition of the synaptolucin signal of C, colored here in red, onto a binary version of the synaptic map. The binary map was constructed by thresholding A such that pixels with an intensity above the 97th percentile appear in black. (Bar = 20 μm.)

