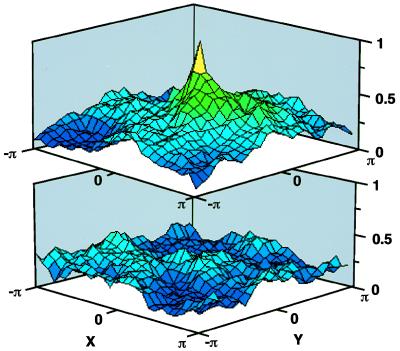
Figure 3.
Matched filtering of two synaptolucin images, Fig. 2 B (control) and C (exocytosis triggered), with their common synaptic map, Fig. 2A, as shown schematically in Fig. 2F. The x- and y-axes indicate the relative shifts between filter and image in these projections, and the ordinate the normalized cross-correlation function, a measure of the match between image and filter (38). The function is computed by pointwise multiplication in the spatial frequency domain and, due to the properties of the Fourier transform, periodic (38). Only a single period, from −π to π in the x- and y-directions, is shown. At shift (0,0), filter and image are in register, at shifts (x,±π) or (±π,y), the filter’s center is displaced to an edge of the image. (Upper) Scanning of Fig. 2C, showing evoked synaptolucin emissions. Note the peak at a filter shift of (0,0), indicating a matching structure in the image. (Lower) Scanning of Fig. 2B, lacking evoked synaptolucin emissions. Note the absence of a central peak.

