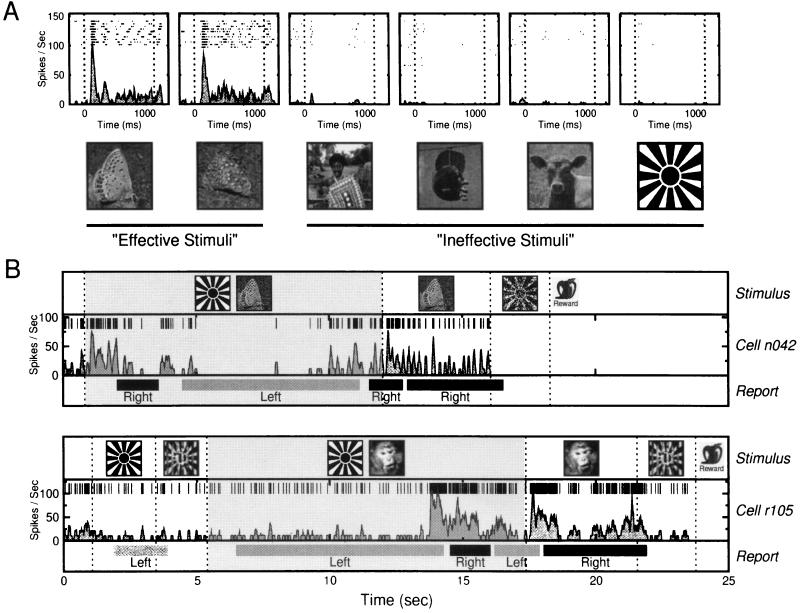
Figure 3.
Neural responses during passive viewing and during the behavioral task. (A) Response selectivity of an IT neuron. Effective stimuli were the two butterfly images, while almost all other tested images (30 tested, 4 shown) elicited little or no response from the cell. Each plot shows aligned rasters of spikes collected just before, during, and after the presentation of the image depicted below the graph. The smooth filled lines in each plot are the mean SDFs for all trials. The dotted vertical lines mark stimulus onset and stimulus removal. (B) Example observation periods taken from the behavioral task for individual cells from monkey N (Upper) and monkey R (Lower). Observation periods during behavioral testing consisted of random combinations of nonrivalrous stimuli and rivalrous periods. Dotted vertical lines mark transitions between stimulus conditions. Rivalry periods, which could occur at any time during an observation period, are shown by the filled gray background. The horizontal light and dark bars show the time periods for which the monkey reported exclusive visibility of the left-lever (sunburst) and right-lever (e.g., butterfly or monkey face) objects. Note that during rivalry the monkey reports changes in the perceived stimulus with no concomitant changes of the displayed images. Such perceptual alternations regularly followed a significant change in the neurons’ activity, as shown by the individual spikes in the middle of each plot and by the SDFs below the spikes. Note the similarity of the responses elicited by the unambiguous presentation of the effective and ineffective stimuli (white regions) with those responses elicited before either stimulus becomes perceptually salient during rivalrous stimulation (gray region).

