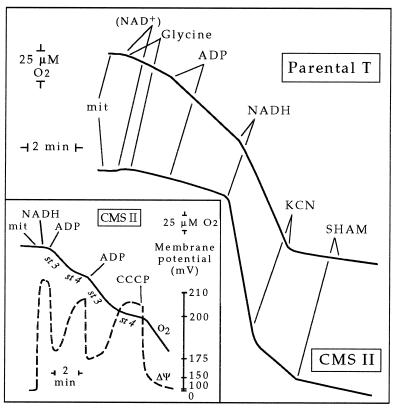
Figure 7.
Recorder traces of respiration measured with purified mitochondria from parental T and mutant CMS II leaves (same with CMS I). Mitochondrial proteins: 150 μg in 3 ml of the assay medium [4 mM glycine/500 μM ADP (main traces) or 75 then 120 μM (Inset)/0.7 mM NADH/0.2 mM KCN/1 mM salicylhydroxamic acid (SHAM)]. (Inset) O2 uptake (solid line) and transmembrane potential ΔΨ (dashed line, with tetraphenylphosphonium+ electrode). st 3, state 3; st 4, state 4.

