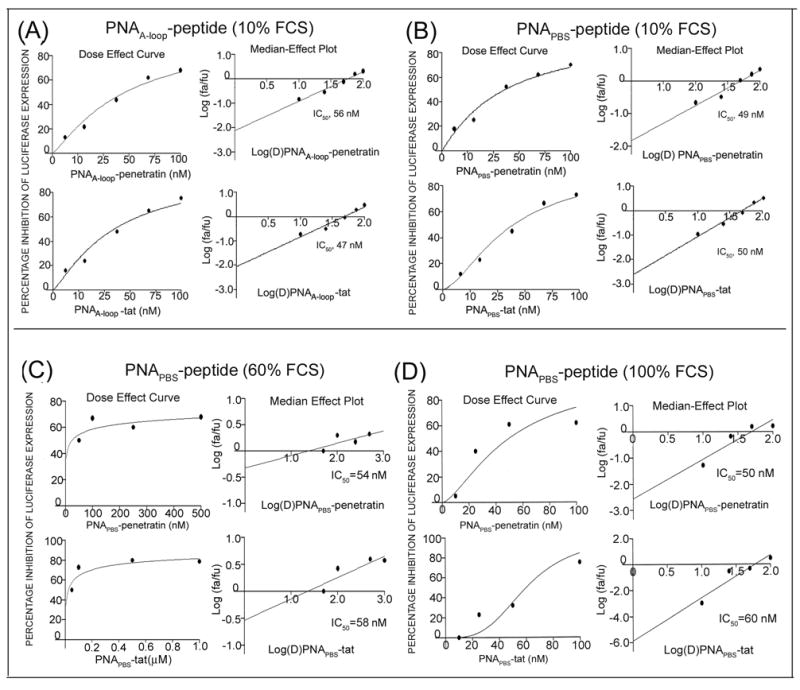
Figure 7. Dose-effect curve (IC50) of virucidal activity of individual PNAPBS- and PNAA-loop-MTD peptide conjugates.

The HIV-1 virions (equivalent to 100 ng of p24) were first incubated with increasing concentrations of individual PNA-MTD peptide conjugates for 2 h in complete RPMI medium containing 10% FCS. Naked PNA and peptides alone were included as control. The pretreated virions were then used to infect the CEM cells. The infected cells were grown for 48 h and the extent of infection was determined by measuring the levels of luciferase reporter enzyme in cell lysate. Dose-effect curves and median-effect plots (IC50) were calculated. Dose-effect curves for virucidal activity of individual PNAA-Loop-MTD peptide conjugate (A), and individual PNAPBS-MTD peptide conjugates in the presence of 10% FCS (B), 60% FCS (C) and 100% FCS (D). No values could be generated for naked PNA and peptide alone.
