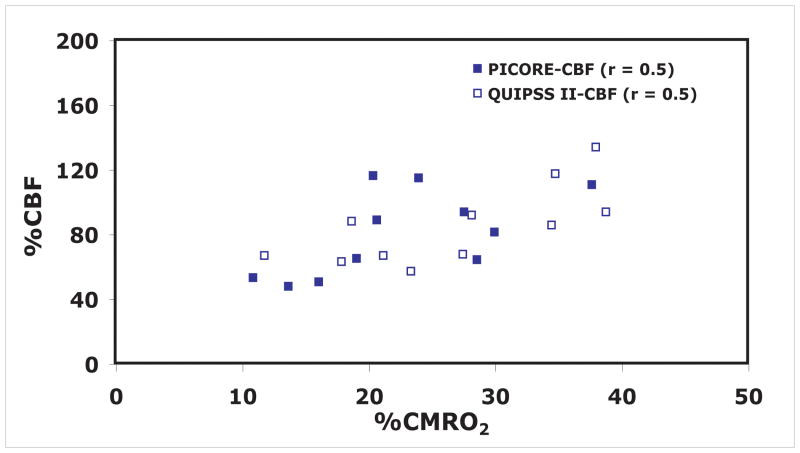
Figure 7.
Fractional changes in calculated CMRO2 as a function of the fractional CBF change during functional activation to test for bias introduced by using the activation data itself to construct an ROI for averaging. The QUIPSS II data was analyzed with two ROI’s, one chosen from a separate localizer data set (solid squares), and one chosen from a correlation analysis of the QUIPSS II data itself (open squares), and the resulting slopes of the CBF/CMRO2 curves (the coupling index n) are not significantly different.

