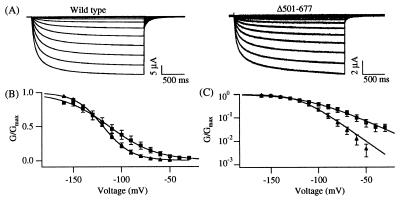
Figure 4.
Decrease in the charge movement of the Δ501–677 channel. (A) Representative current traces of KAT1 wild-type (Left) and the channel mutant Δ501–677 (Right) elicited in response to voltage pulses from −150 mV to −30 mV in 10-mV increments from a holding voltage of −10 mV. The Δ501–677 currents were recorded in the presence of 50 mM KCl, 90 mM NaCl, 2 mM MgCl2, 0.5 mM CaCl2, and 10 mM Hepes (pH 7.2). (B) Linear plot of normalized G–V curves determined for KAT1 wild-type (Δ, n = 5) and the Δ501–677 channel (□, n = 7) from the same batch of oocytes. The extracellular solution contained 20 mM KCl, 120 mM NaCl, 2 mM MgCl2, 10 mM Hepes (pH 7.2). (C) Semilogarithmic plot of the G–V curves shown in B. Similar half-activation voltages and equivalent gating charges were estimated for the Δ501–677 channel in the presence of different extracellular K+ concentrations (20 mM K+ in B and C vs. 50 mM K+ in Fig. 5 A and B).

