Figure 5.
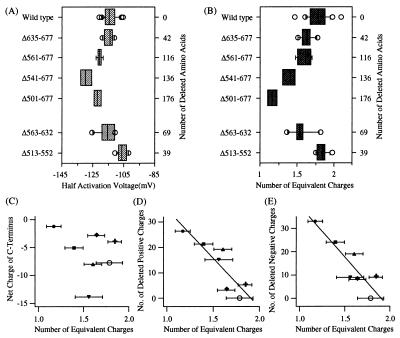
Voltage dependence of the C-terminal deletion mutant channels. Box plots of the half-activation voltage (A) and the number of equivalent charges associated with steady-state activation (B) are shown for KAT1 wild-type and the functional C-terminal deletion mutants (nwild type = 20; nΔ635–677 = 6; nΔ561–677 = 5; nΔ541–677 = 4; nΔ501–677 = 4; nΔ563–632 = 6; nΔ513–532 = 9). The two-electrode voltage-clamp measurements for the Δ501–677 channel in A and B were performed with additional 0.5 mM CaCl2 in the extracellular solution. (C–E) The mean of the number of equivalent charges calculated for the wild-type channel (open circle) and the mutant channels were plotted against the corresponding net charge remaining in the entire C-terminal domain (C) or against the corresponding number of positively (D) or negatively (E) charged amino acids removed from the C terminus. Data points were analyzed with a simple linear regression (solid lines) with R = −0.907 in B, R = −0.287 in C, R = −0.873 in D, and R = −0.893 in E. Symbols have following meanings: the Δ513–552 channel, +; the Δ635–677 channel, ♦; the Δ563–632 channel, ▾; the Δ561–677 channel, ▴; the Δ541–677 channel, ▪; the Δ501–677 channel, •.

