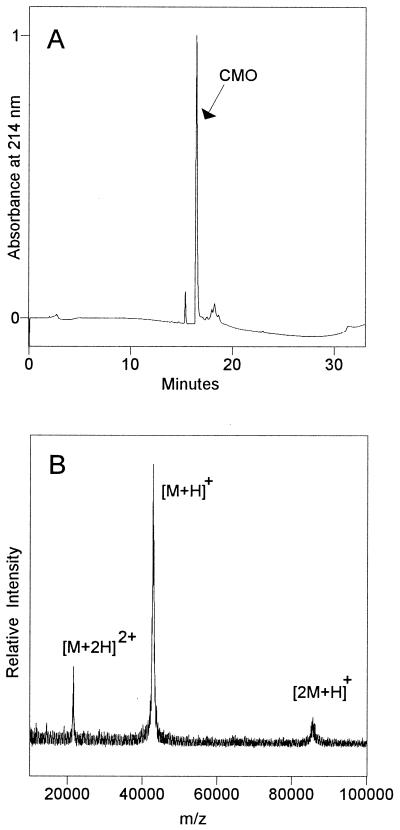
Figure 1.
Subunit composition of CMO and Mr of the monomer. (A) HPLC elution profile of a native CMO preparation (5.4 μg of protein). The cluster of small peaks eluting at ≈17–19 min contained no polypeptides detectable by MALDI-MS. Between analyses of the same preparation, the contaminant peak eluting at ≈15 min varied in size from <1% to 6% (shown here) of the CMO peak. (B) MALDI mass spectrum of the CMO peak from the HPLC separation above. The major signal corresponds to the singly protonated CMO monomer [M+H]+; other peaks are the singly charged CMO dimer [2M+H]+ and the doubly charged monomer [M+2H]2+. The spectrum is unsmoothed to maximize the detection of any heterogeneity.

