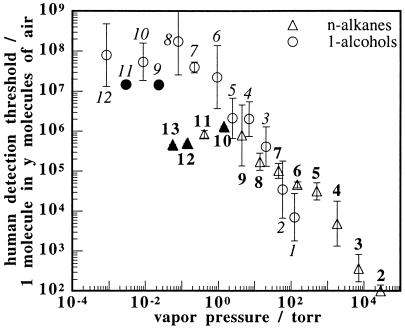
Figure 3.
Plot of human olfactory detection thresholds versus the vapor pressure (at 25°C) of a homologous series of straight chain alkanes, ranging from ethane to tridecane, and of 1-alcohols ranging from methanol to dodecanol. For clarity, number of carbons in each odorant is indicated next to the corresponding data point, in italic type for the alcohols and nonitalic type for the alkanes. An average human can detect one odorant molecule in the number of air molecules plotted on the ordinate. The error bars represent one SD unit in the standardized results reported by at least two, and up to 20, authors (1). A solid data point is used if only one author reported results. A best straight line fit through the alcohols from methanol to octanol gives a slope of −1.3 ± 0.1 and an r2 value of 0.96. Similarly, a best straight line fit through the alkanes from ethane through decane gives a slope of −0.94 ± 0.08 and an r2 value of 0.96.

