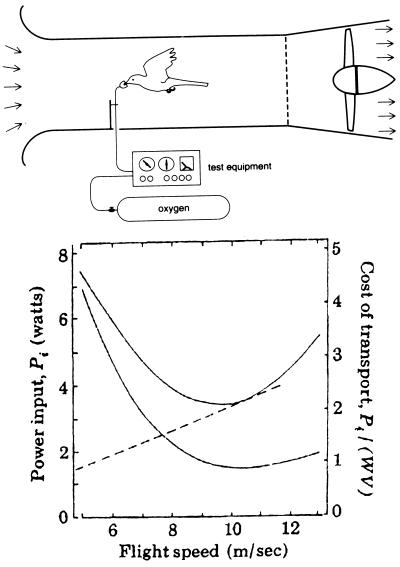
Figure 10.
(Upper) Vance Tucker’s budgerigar in the wind tunnel. [Reproduced with permission from ref. 6. (Copyright 1992 and 1996, Henk Tennekes. Reprinted by permission of MIT Press.)] (Lower) The curves show the dependence on speed of power input (upper solid line), and energy cost of transport (bottom solid line), for the budgerigar in level flight. The energy cost of transport has its minimum at a higher speed than for the power input, and corresponds to the value where a dashed line drawn through the origin of the axes for power input and flight speed is tangent to the corresponding curve. [Reproduced from ref. 9 with permission. (Copyright 1975. Reprinted with permission from American Scientist.)]

