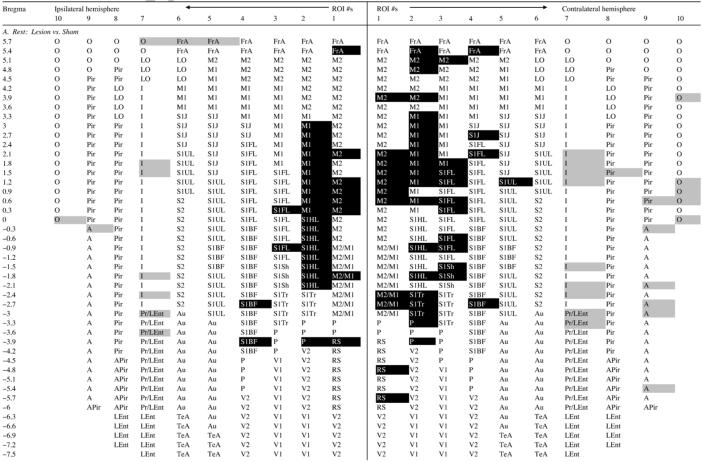
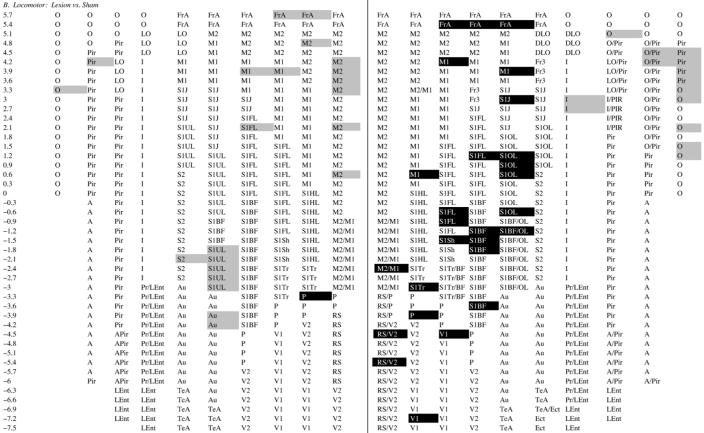
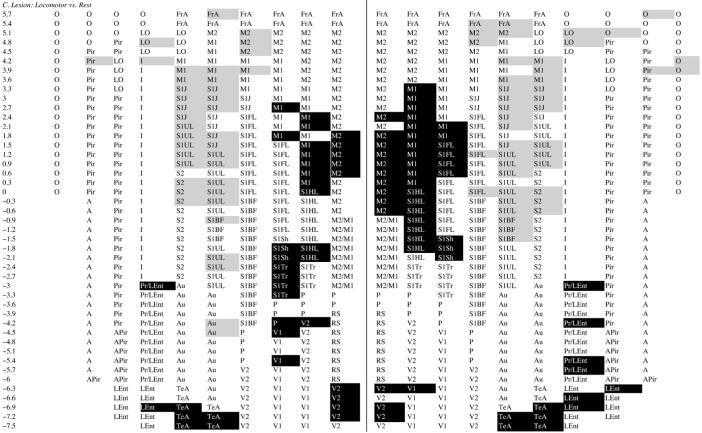
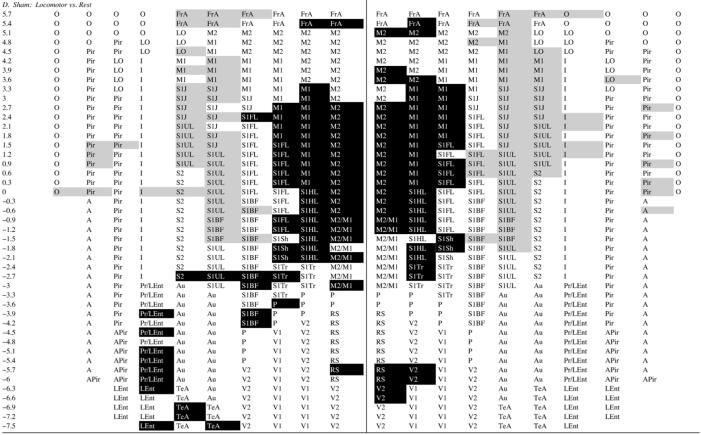
Table 1.
Regions of statistically significant differences of functional brain activation on the surface of the flattened cortex as determined by ROI analysis
Group comparisons are between z-scores of regional cortical perfusion. Shaded cells represent group differences significant at the p < 0.05 level. White text on a black background represents increases in cortical perfusion in each group comparison, i.e. z-score difference > 0. Black text on a gray background represent decreases in cortical perfusion for the comparison, i.e. z-score difference < 0. Rows represent coronal slices from rostral to caudal, with distances to bregma in millimeters. Within each slice cortical location nos. 1-10 are depicted from medial to lateral for both cerebral hemisphere (ipsilateral and contralateral to the striatal injections). Abbreviations of the anatomic regions are as defined in Fig. 3.


