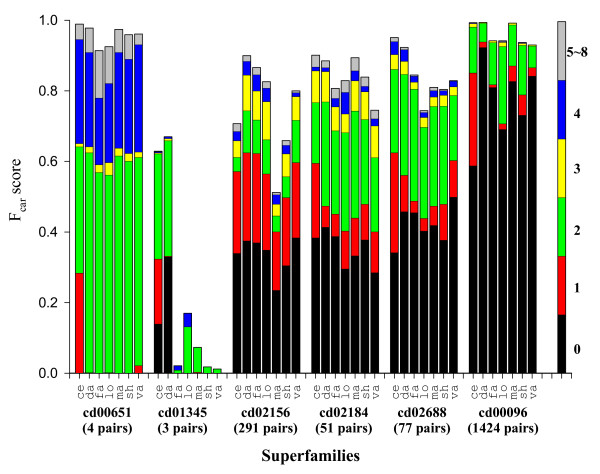
Figure 12.
Shift error profiles of the five outlier superfamilies from Figure 11 and the largest superfamily. The name of the superfamily, and the number of the alignment pairs in it are shown at the bottom of the figure. The largest superfamily (cd00096, immunoglobulins) is included for reference as a "typical" superfamily. In each superfamily, seven methods are indicated by the first two letters of their names. Each bar is broken into segments whose length gives the fraction of the aligned residues with a given shift error, which is indicated in color according to the coloring scheme shown in the single bar on the right. Since most of the shift errors are at most 4 residues, the fractions having more than 4 residues were combined into one.

