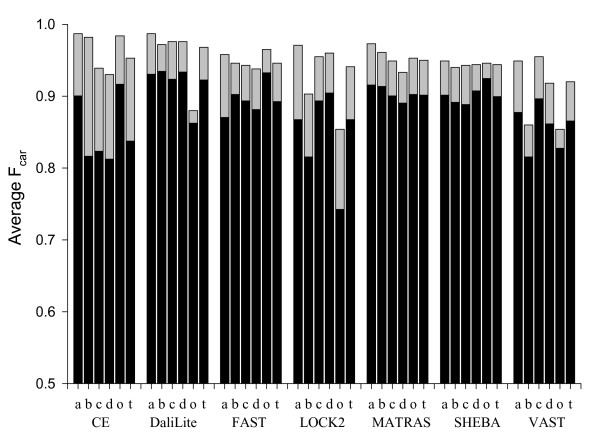
Figure 14.
Dependence of Fcar on the protein structural classes. The Fcar(0) (solid bar) and Fcar(8) (full bar) values were grouped and averaged over each SCOP class. For this analysis the 5 extreme superfamilies from Figure 11 were not included. The symbols a, b, c, d, and t represent all-α, all-β, α/β, α+β, "others" and all classes, respectively. The method names are given on the x-axis.

