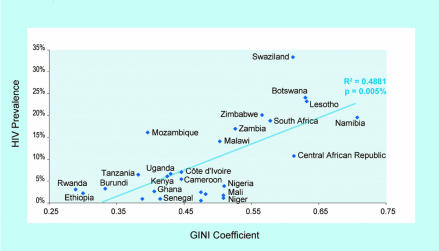
Figure 1. HIV Prevalence and Income Inequality in Africa.
The Gini coefficient has a value between 0 and 1, representing the extremes of income distribution. A zero value corresponds to the situation where everyone in the population has exactly the same income, whereas a value of 1 would correspond to extreme concentration of income in one person. A high value indicates a more unequal income distribution. Note that Figure 1 uses data from only one year and therefore cannot show any dynamic relationship between changes in income inequality (which are slow), and changes in HIV prevalence.

