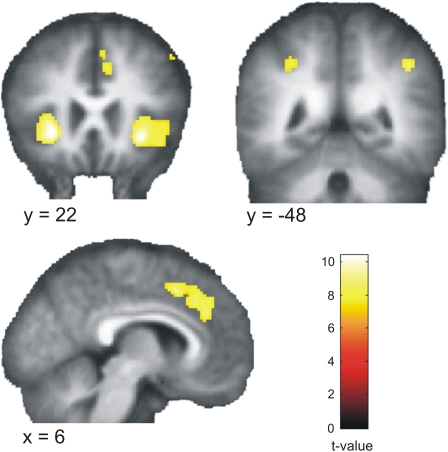
Figure 6. Study 2 Functional Imaging Data: Retrieval and Comparison.
Areas that show stronger activation (p < 0.05, FWE corrected) for retrieval and comparison than encoding, rendered on coronal (y = 22 and y = −48, top left and right, respectively), and sagittal (x = 6, bottom left) sections of participants' normalised average structural scan. See also Table S1 for exact MNI coordinates.

