
Fig. 1.
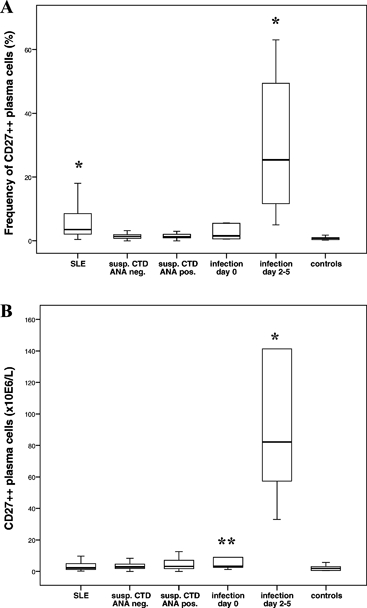
Box-and-whisker plot of frequencies (A) and absolute number (B) of CD27++ plasma cells in peripheral blood from patients with SLE (N = 30), patients suspected of connective tissue disease (ANA negative, N = 75; ANA positive, N = 45), patients with bacterial infection (N = 6) on day 0 and day 2–5 after hospital admission, and healthy donors (controls, N = 16). The lower and upper limits of each box represent the 25th and 75th percentile, respectively. The horizontal bar within each box indicates the median. The whiskers emerging from the boxes extend to the upper and lower adjacent values and are defined as values < 1.5 times the box height. Significant differences from controls are shown (*P < 0.001,**P = 0.03).