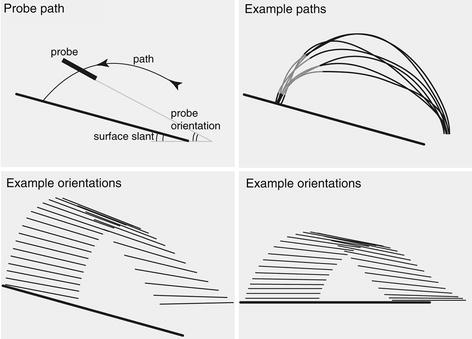
Fig. 5.

The upper left panel gives a schematic side view of the probe’s path (curved thin line) towards the slanted surface (straight thick line). The position and orientation of the probe were measured by the optotrak system. The upper right panel shows a side view of a few paths towards the ‘far’ target position. The average probe orientation is determined during the last 100 to 20 mm before the end of the movement (indicated schematically by the dark-grey line segments). The lower panels show examples of the probe orientation with time intervals of 25 ms
